Purpose
The purpose of this lab was to develop and enhance an understanding of how to calculate both tension and the friction coefficient µ using real world examples.
The purpose of this lab was to develop and enhance an understanding of how to calculate both tension and the friction coefficient µ using real world examples.
Materials
Inclined Plane
Wooden Box
Marked Weights
String
Sonar motion detector
Inclined Plane
Wooden Box
Marked Weights
String
Sonar motion detector
Procedure
The independent variables in the experiment were the masses M1 and M2. The dependent variable is the coefficient of friction µ. The masses remained constant throughout.
The first half of the lab went through the theory of the lab. Students were asked to write the formulas for the acceleration of the system, solve for friction, and solve for µ, without using any numbers. The resulting formulas are listed on the attached sheet.
| scan0006.pdf |
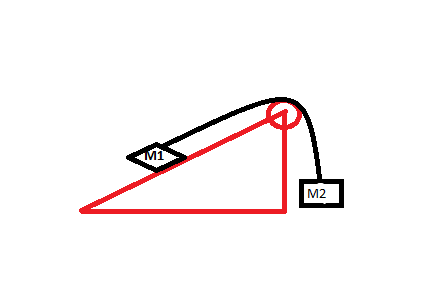
The next step was to perform the experiment. The experiment consisted of hanging a weight M1 off of an inclined plane using string attached to a box of mass M2 which we held at rest on the inclined plane. Using a sonar motion detector, we were able to electronically track the position of the box in relation to time. Using LoggerProData on the motion detector, we were able to find a best fit line for the position.
We finally found the angle Θ by finding the arctan of the horizontal length of the inclined plane divided by the vertical height of the same plane.
We finally found the angle Θ by finding the arctan of the horizontal length of the inclined plane divided by the vertical height of the same plane.
| austin_jord_james_trial_1.cmbl |
| austin_jord_james_trial_2.cmbl |
| austin_jord_james_trial_3.cmbl |
Data is in attached files above.
Analysis
The graphs are in the above file. The results of the graph show that there are accelerations of .2772 and .2806. These are reasonably close together, within 2% so we may assume that they are accurate. There was also an outlier acceleration of .3820, which has been exempted as it was most likely the result of an equipment malfunction. The slope of the line in these graphs indicated the velocity of the box at time T.
The graphs are in the above file. The results of the graph show that there are accelerations of .2772 and .2806. These are reasonably close together, within 2% so we may assume that they are accurate. There was also an outlier acceleration of .3820, which has been exempted as it was most likely the result of an equipment malfunction. The slope of the line in these graphs indicated the velocity of the box at time T.
Conclusion
Students may conclude that for this type of system µ = a (M2 - M1) + M2g - M2gsin(Θ)
mgcos(Θ)
and that T = mg-ma
During the course of the experiment, there was an unexpected error that occurred with the motion sensor. It incorrectly measured a distance that a vast outlier, which disrupted the acceleration of the curve by over 33%. This acceleration was excluded as inaccurate in the analysis.
