Motion and Acceleration Car Lab
Purpose1. Observe motion via video analysis
2. Collect position vs. time data 3. Plot position vs. time and add best fit line 4. Derive velocity function from best fit equation |
MaterialsCar
Board for distance measurement Stand for board Video camera |
Observe Motion via Video Analysis
This video illustrates the actual motion of the car. We will use the video to determine the motion of the car, using the front end of the car as the objects location and the board behind to determine a position. Since the video begins before the object reaches the front end of the board, we will adjust the origin so that when t=0, position=0.
Collect Position vs Time Data
In this portion of the lab, using frame by frame calculations, we were able to use the time interval of .067 seconds. Distance was measured using the large board with precise metric measurements in the background of the video as a site location. T=0 occurs when position is also 0, even though both the video and the car started before this occurs. This was done by subtracting the time in the video by the time it took the car to reach a position of 0.

Plot Position vs Time and Add Best Fit Line
Using the above table to plot position vs time in Microsoft Excel, we obtain a dot plot of the below graph. We then used the built in best fit line finder for Excel to obtain the best fit line. This line was transcribed onto the plot for us by Excel.
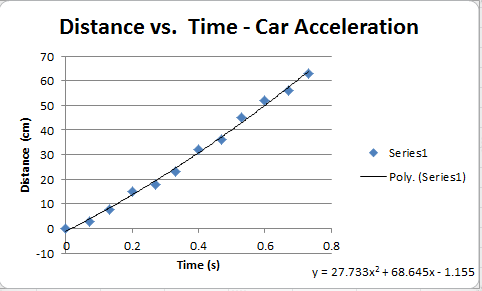
Derive Velocity Function from Best Fit Line
Given the position function for the car is y=27.733x²+68.645x-1.155, in order to find the velocity function we take the derivative of the given function. The resulting function is y=2(27.733)(x^2-1)+1(68.645)(x^1-1)-0(1.155)(x^0-1). We may simplify this expression to y=55.466x+68.645.
This means that the velocity increases at a rate of .55466 m/s with an initial velocity of 68.645.
This means that the velocity increases at a rate of .55466 m/s with an initial velocity of 68.645.
